Feedback Toolkit
  • Home
  • About
  • Your experience
  • en
    • it
    • sl
    • pt

Guide the Line

Let your thoughts and feelings guide the pen across the graph. Use this feedback tool to help you identify levels of productivity, team satisfaction or happiness.

  • Activity aim

    Transformation
  • Activity timing

    5-10 minutes
  • Activity size

    Individual

Tools

  • Pen
  • Paper

Steps

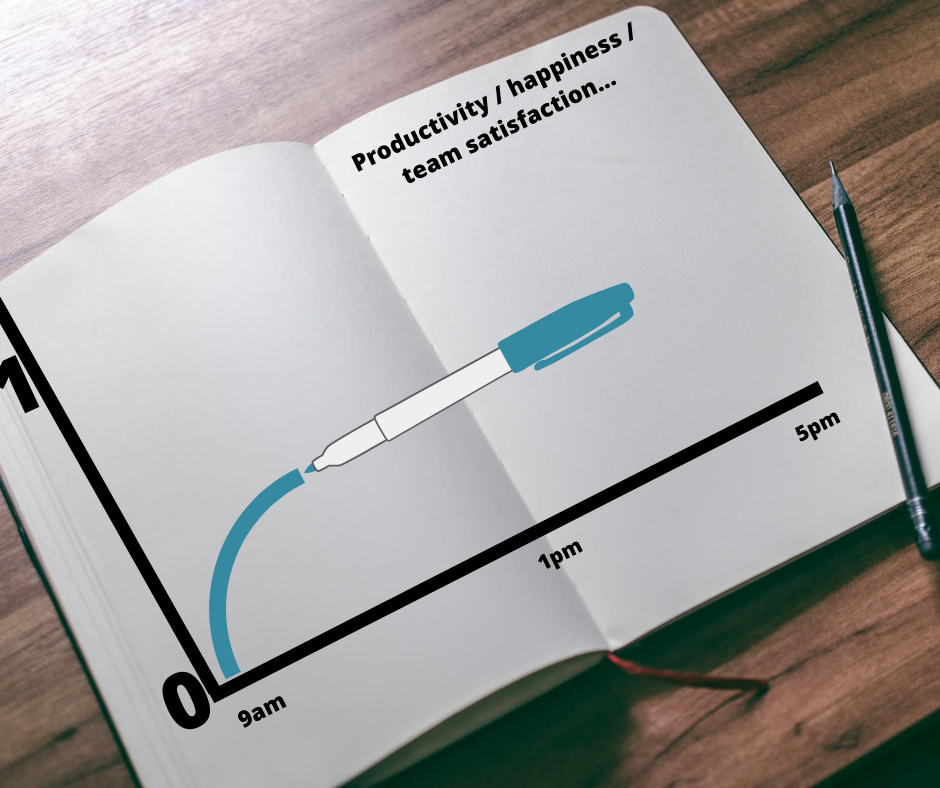
  • Grab your pen and paper and draw a simple graph with an x and y axis.
  • Up the side label it 0 to 1 and across the bottom add the times of day.
  • Choose a time interval when you want to record your data.
  • Plot a dot every hour in regards to the topic in question (e.g. focus, happiness, productivity).
  • Join the dots up to allow you to see what time you were the happiest/ most productive or focused.
  • You could repeat this for several days and see if a pattern emerges.
  • Discuss this with the facilitator, teacher or employer (depending on setting this exercise is carried out in).

Tips

  • Record your line regularly and discuss progress with others.
  • Try to identify reasons for specific patterns.

Sources

Created by Inova Consultancy as part of the Feedback project.

Creative Commons License

This work is licensed under a Creative Commons Attribution 4.0 International License.

Post navigation

Helium Floating Feelings

We believe in the power of feedback

  • Privacy policy

Follow us!

Co-funded by the Erasmus+ Programme of the European Union

European Union

The European Commission support for the production of this publication does not constitute an endorsement of the contents which reflects the views only of the authors, and the Commission cannot be held responsible for any use which may be made of the information contained therein